Master Thesis
During my master thesis I tuned, trained and tested a multitude of supervised Machine Learning (ML) techniques to predict the probability of later development of various atopic conditions such as asthma and eczema using infant gut microbiome data. In other words we investigated if it was possible to predict which infants will develop atopic conditions before the age of 11 using gut microbiome data that was collected at an age of 1 month post partum. In addition to microbiome data, I also had clinical variables, including information about maternal and paternal atopy, environmental exposures, etc. I tested the predictive performance of the models using the microbiome and clinical data seperately, but also with the combination of the two feature sets. In order to fuse the two feature sets I tested O2PLS and DIABLO, which are both sustainable mid-level data fusion techniques. The ML techniques that were used are XGBoost, Random Forest, Sparse Partial Least Squares Discriminant Analysis, Support Vector Machine, and Logisitc Regression.
Due to a confiditentiality agreement I cannot share the thesis or any of the results. Nevertheless, I would like to show one type of visualisation that I created during my thesis. Do note however, that these results are purely fictional and do not reflect the real results from the thesis whatsoever.
Figure 1: Radar chart of the predictive performance of multiple machine learning models. The colours represent different machine learning models as indicated in the legend. All metrics are shown on the scale of percentages. The mean log loss is shown as “1 – log loss” as it has been inverted, such that higher values correspond to a better model, just as all other metrics. Any mean log loss higher than one was capped at one such that in this figure they cannot go below zero.
Bachelor Thesis
This thesis aimed at the improvement of large multi-omics network visualisations by utilisation of virtual reality. Due to the increasing size of biological datasets, it is getting more challenging to properly visualise such datasets in 2D. Therefore, different approaches should be considered, like virtual reality. In this thesis, an interactive virtual reality network of multi-omics data was developed and compared to a pre-existing 2D network from the same dataset. Finally, the virtual reality visualisation was compared to the 2D visualisation through conducting a cross-over design study where participants had to test the visualisations and, subsequently, evaluate them with a Likert scale survey. Essentially, no significant differences were found between the two types of visualisations from the survey data. However, the feedback was generally positive indicating that virtual reality visualisation has the potential to serve as an appropriate way of visualising multi-omics data but should still be further developed and tested.
To see the VR visualisation in action, where a genetic network is explored using state of the art infrared hand-tracking technology (leap motion), play the video below:
Final high school project (profielwerkstuk)
At the end of my studies at Trevianum, my pre-university education, I did my final project on the visualisation of the paracetamol-induced changes in the respiratory chain in mitochondria of cultured human liver cells. I did so in collaboration with Jian Jiang from the department of Toxicogenomics at Maastricht University who, at the time, was doing her PhD on Mechanisms of Drug-Induced Liver Injury. The goal of this study was to research the hepatotoxicity of paracetamol (APAP) by analysing whole-genome gene expression data. Her study revealed that a dose of 10mM APAP results in an increase in Reactive Oxygen Species (ROS) formation and disrupts the assembly, stability and structural integrity of Electron Transport Chain (ETC) complexes. Ultimately, resulting in electron leakage into the cell, depleting the cell of ATP, thus, possibly inducing cell death. This is a very brief summary of the research and only a small proportion of the entire thesis, if you are interested and would like to read more, click here: Read More…, or send me a message for a free pdf.
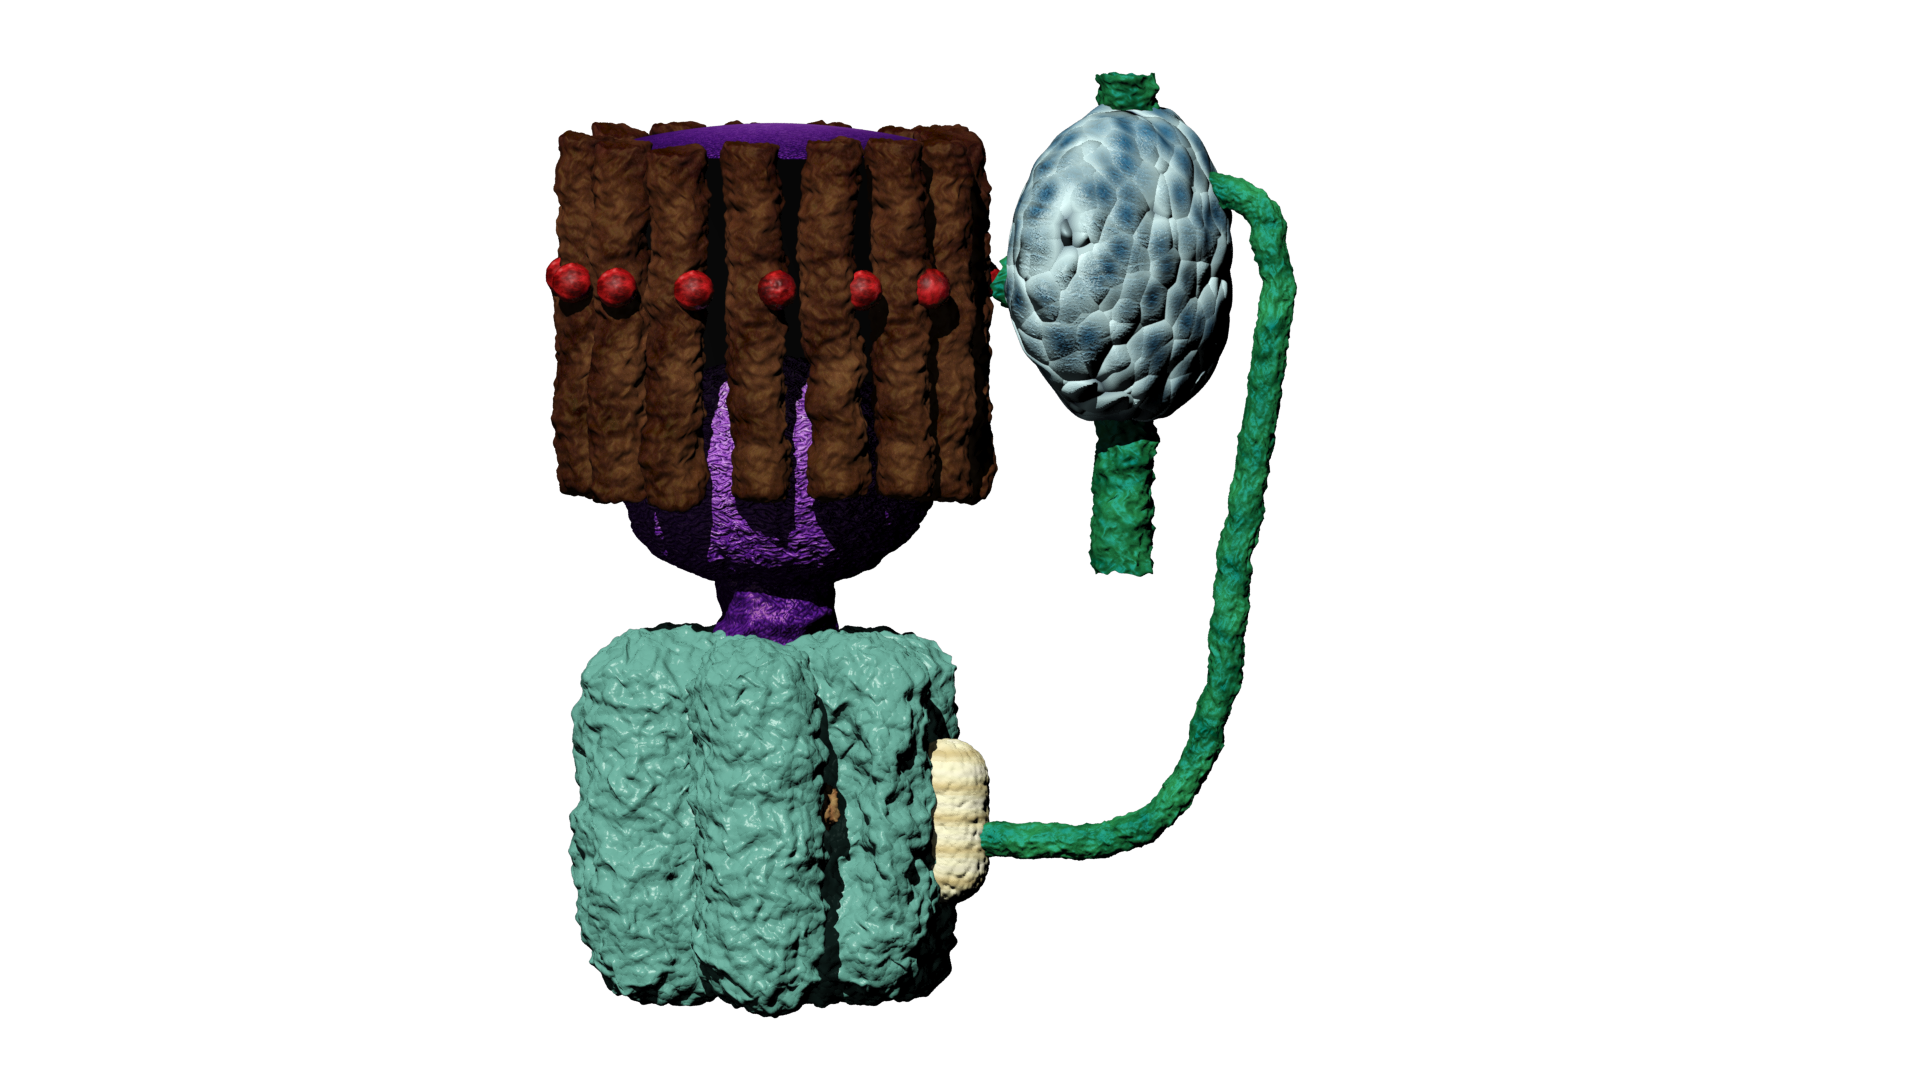
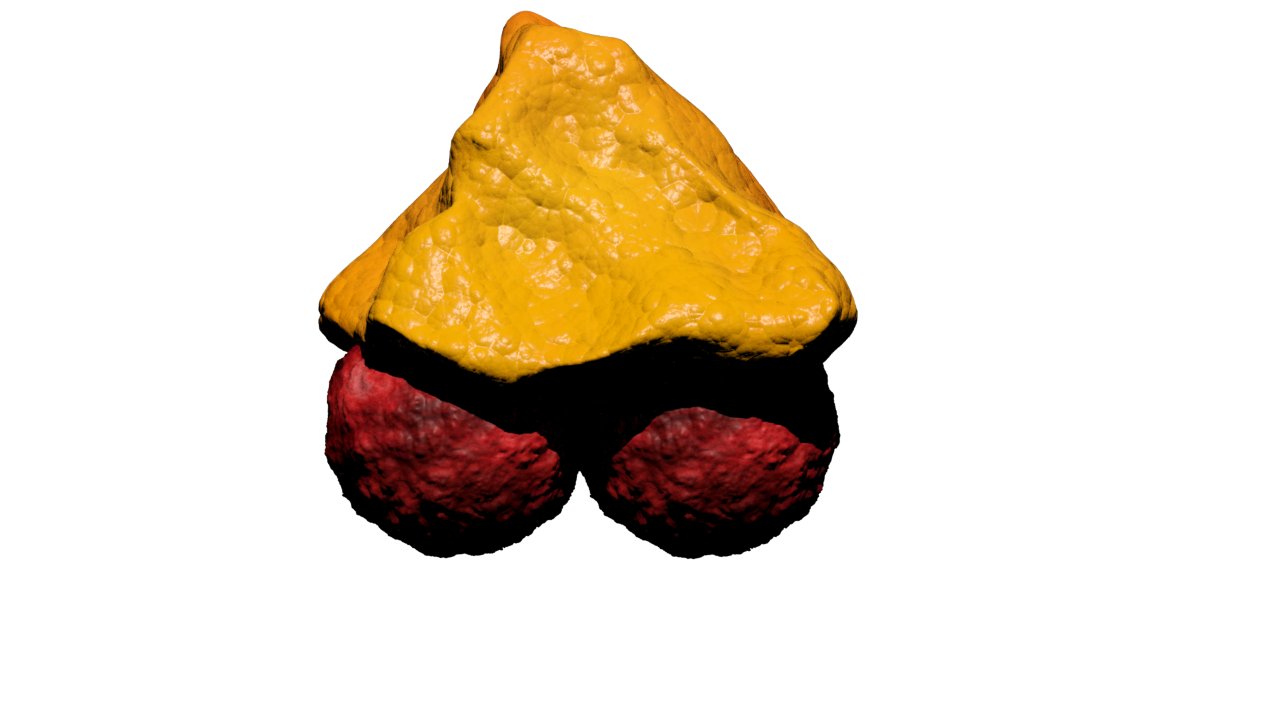
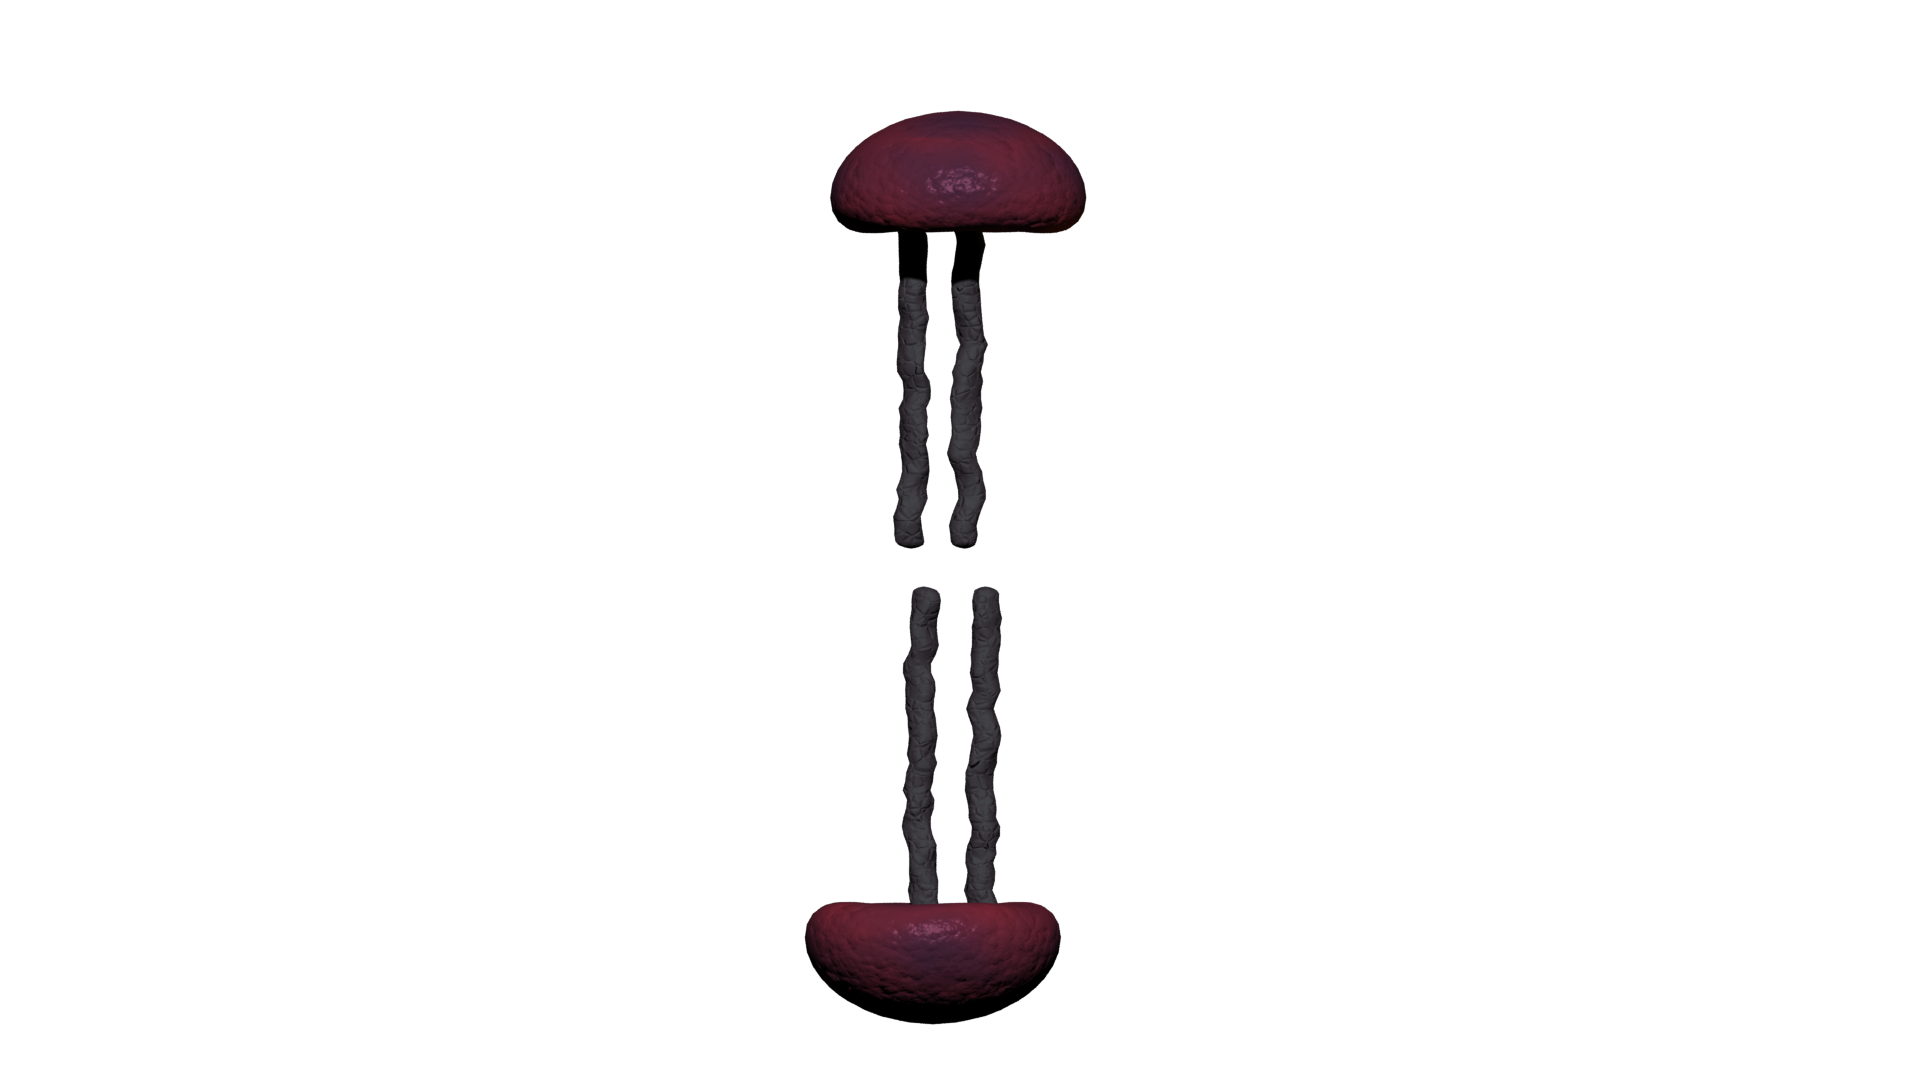
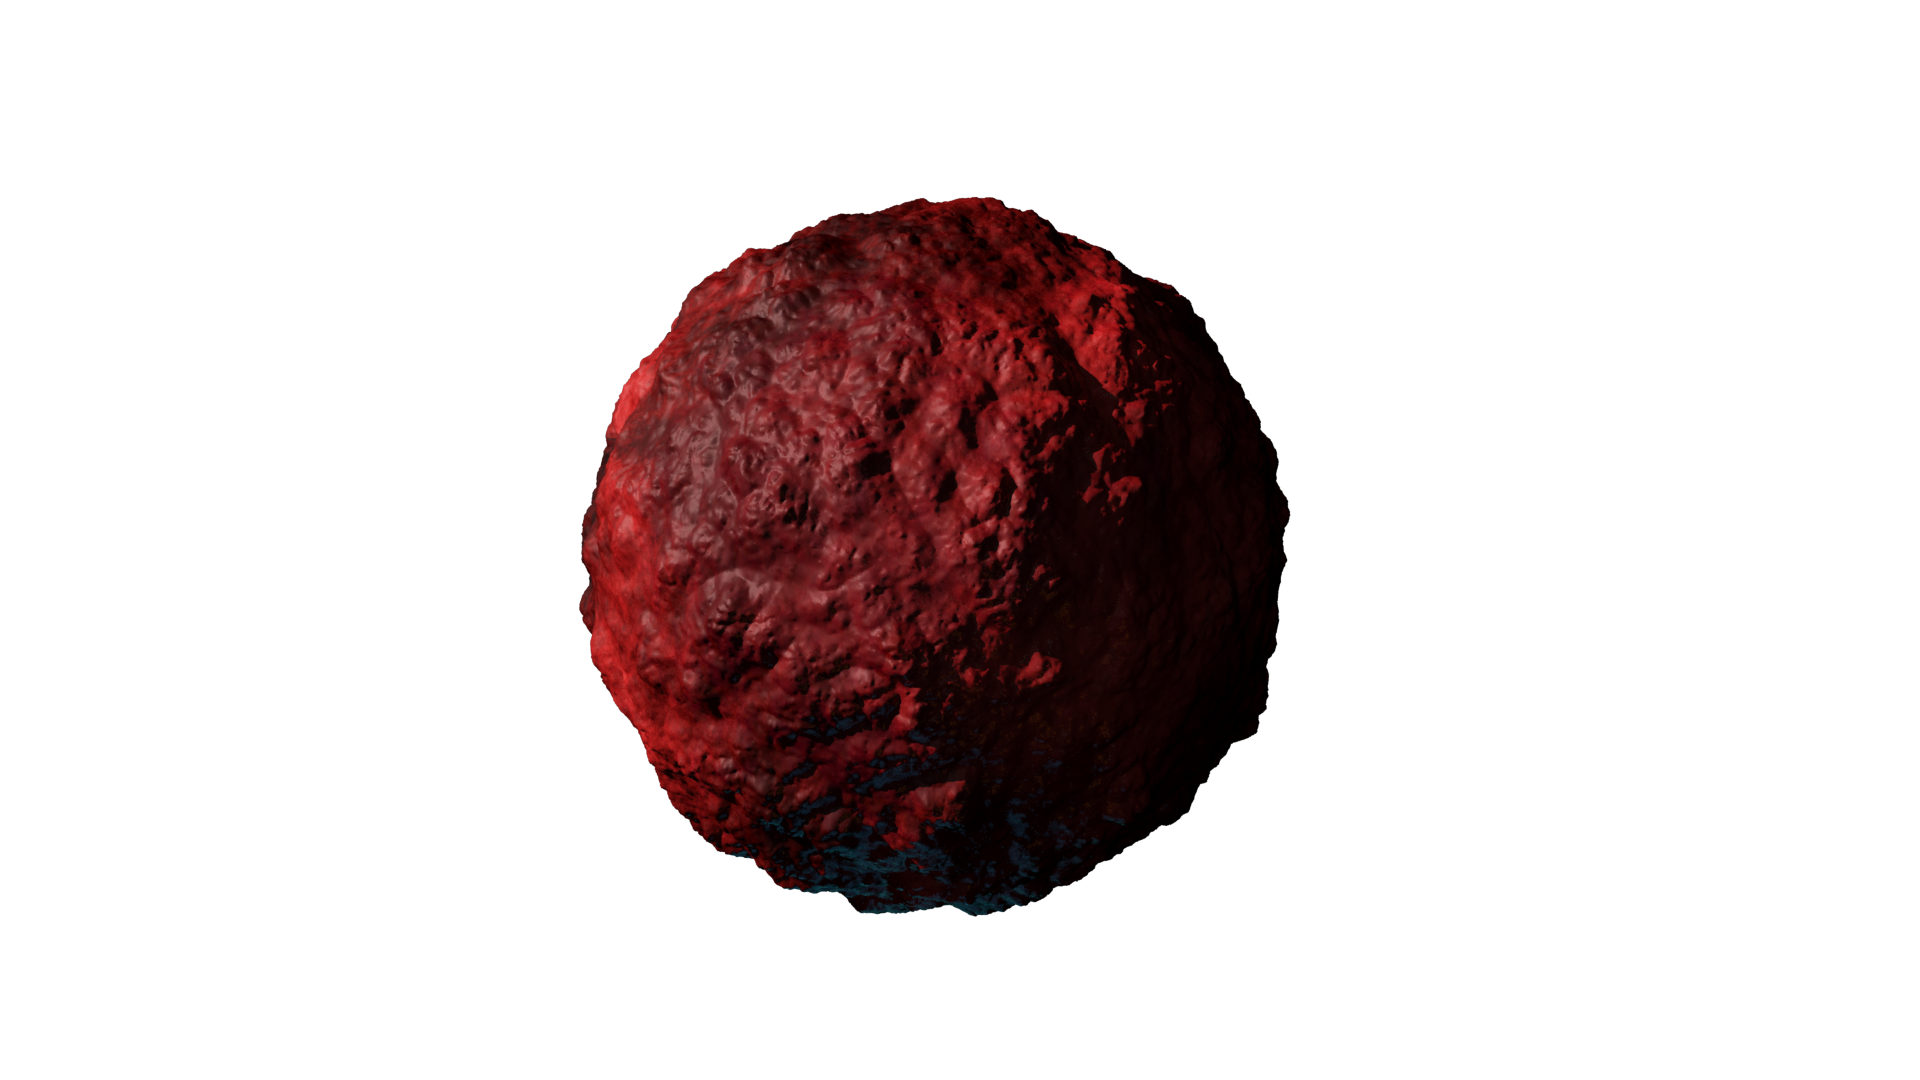
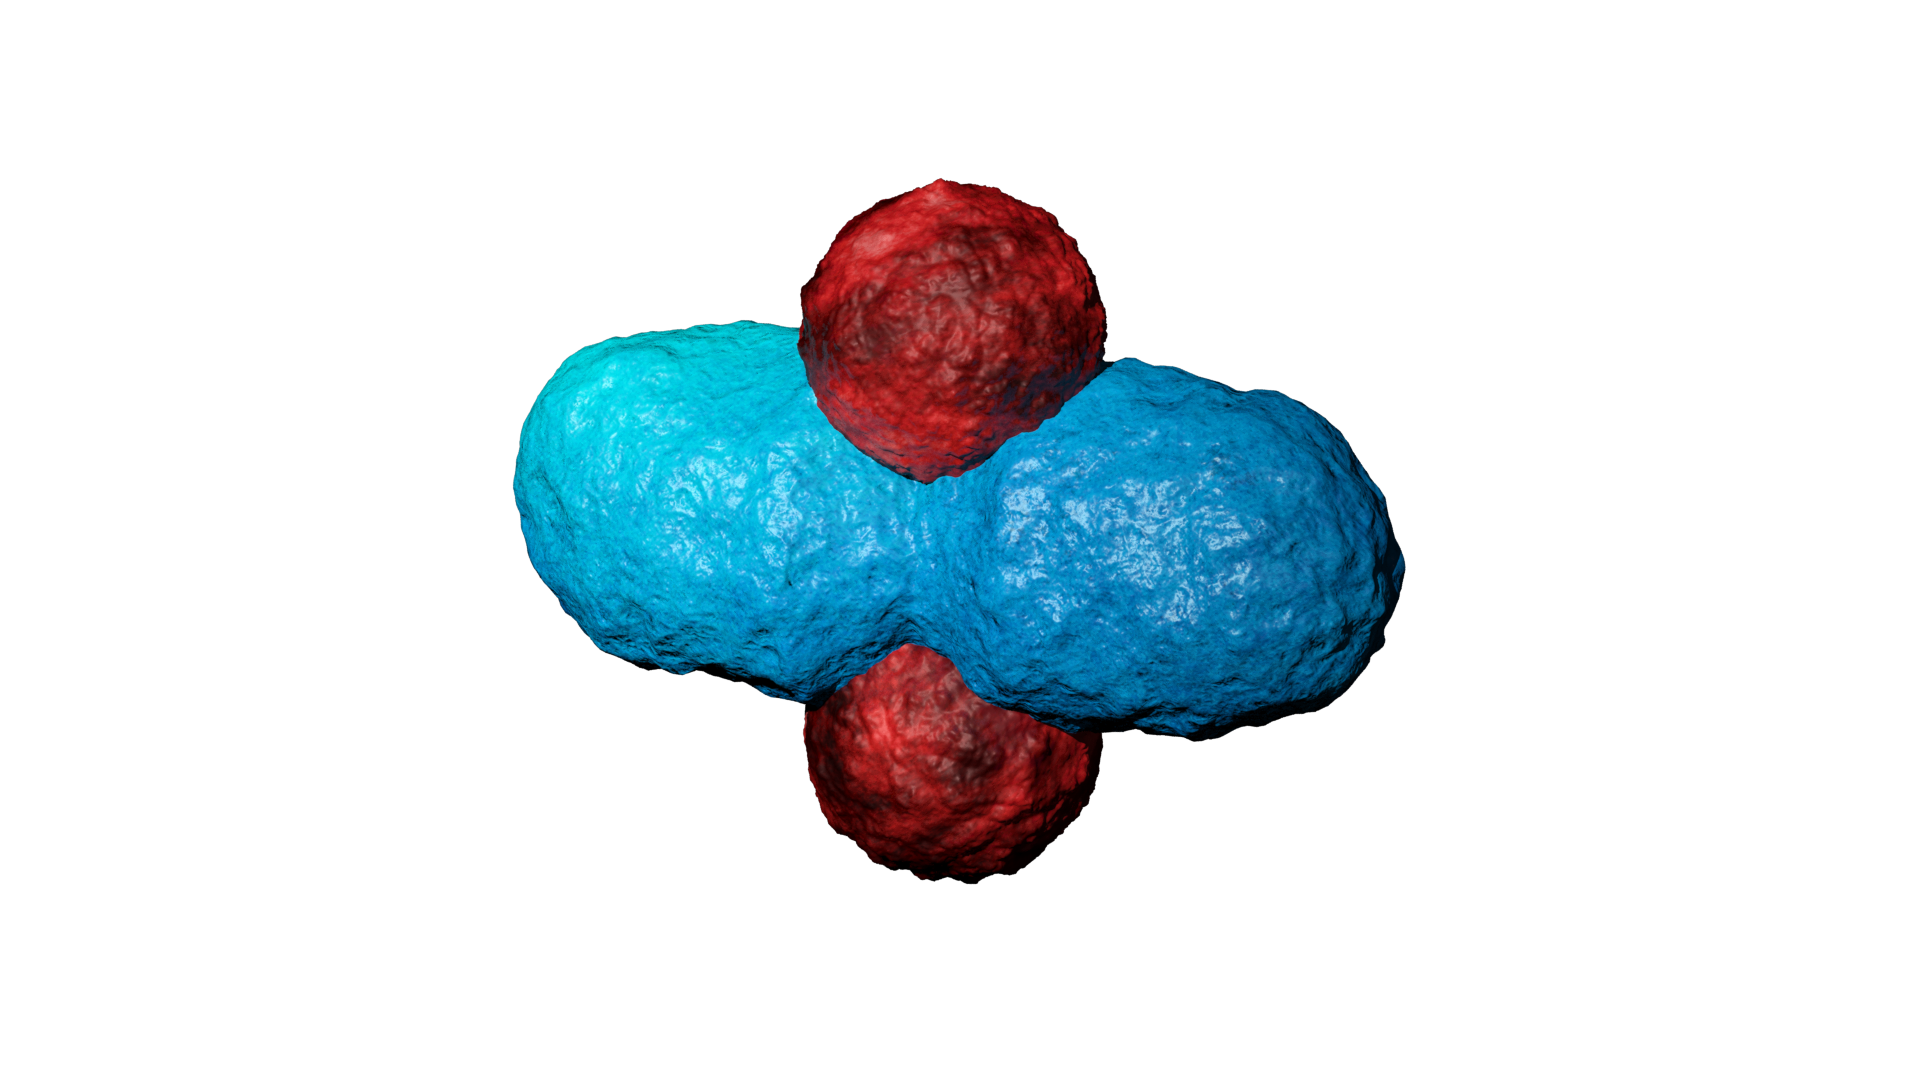
As I heard about this research I saw an opportunity to visualise this in a 3D environment to visually explain the data. This was done, by first modelling all individual component like the phospholipids, inter-membrane proteins, ATP, proton (carriers) and so forth. Here, arguably the most challenging part was to shape the components because there is no actual proof of their appearance due their incredibly small size and the complexity of protein folding. Therefore, most models were based on their molecular composition and appearance in scientific schematics, and of course, a little bit of artistic freedom. With all individual components modelled and textured, the animating part was commenced, ATP synthase was animated to illustrate proton binding and release, inducing the rotary motion which acts as power supply for ATP synthesis. Protons were animated using a particle system, illustrating their chaotic movement and inability to travel through the membrane. Additionally, the co-enzymes were animated to illustrate the electron transport chain in accordance to each other. Finally, I did a voice over to explain the electron transport chain and the effect of APAP on the ETC complexes. Moreover, I edited-in some blurring and numbering to clarify what part of the ETC is being discussed. Due to the used terminology and assumption of background knowledge, the animation can be challenging to understand for a layman. However, do not hesitate to have a look at the animation below:
ATP synthase

3D Modeling
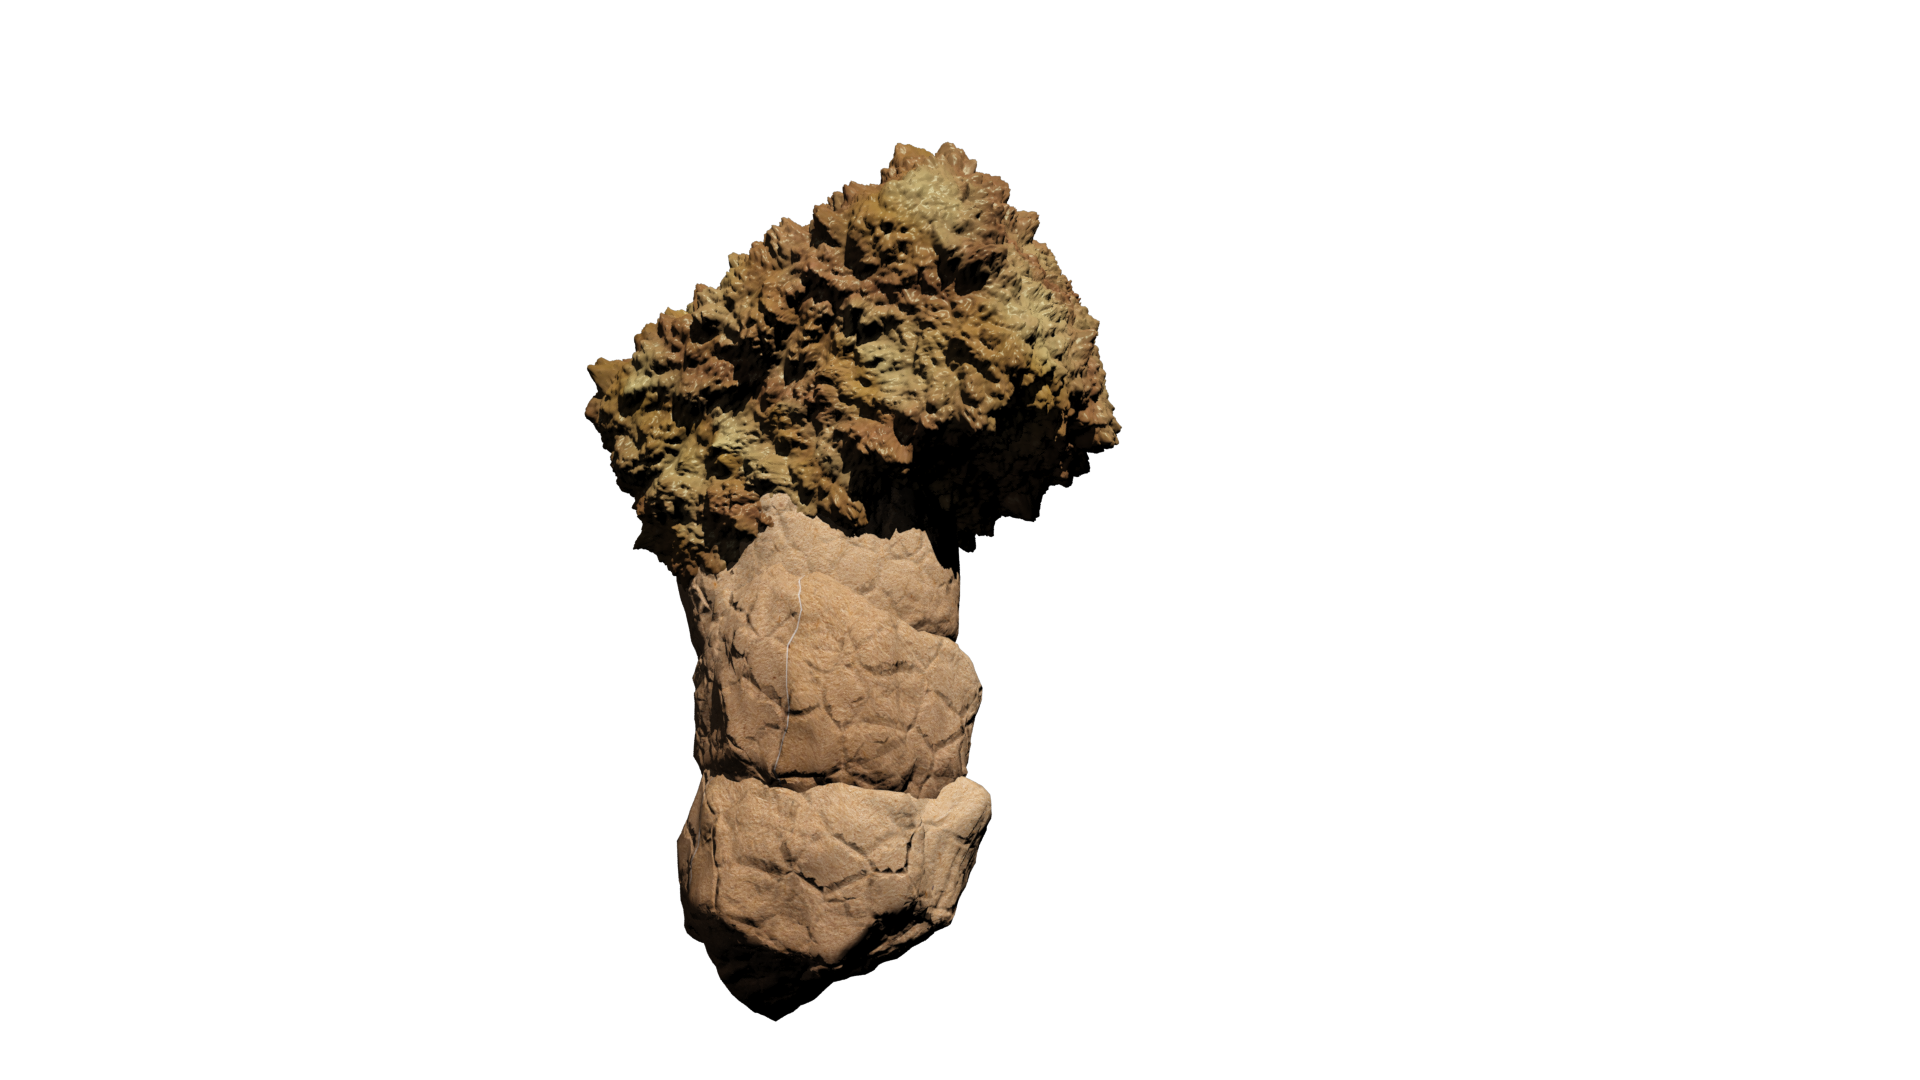
As a kid I have always been intrigued by computers and the new possibilities they offer when it comes to art. Especially, I was interested in the construction of 3D models as was done in CGI animations and video games. Therefore, I started playing around with various 3D modelling- and sculpting applications like blender and 3ds max. Soon I realized, it would be a challenging hobby but far from impossible, thus, I started following various tutorials and eventually created some models from scratch. Additionally, I started combining this with drawing, which I often did during my holidays. Drawing my creations in multiple perspectives (e.g. from the front, side and top) allowed me to relatively easily reconstruct them in 3D. My main interest at the time was modelling magical creatures, specifically dragons. However, this is a rather challenging concept to properly develop in 3D, so a fully modelled, textured and rigged dragon is still a work in progress. As is the case with many hobbies, it is very time consuming. Therefore, there are many projects I have been working on for a long time that still have to be finished. However, during my last year of high school, I figured I could incorporate this hobby into my final school project. Here, I modelled and animated the respiratory chain of a mitochondria under exposure of paracetamol, to illustrate some of its hepatotoxic effects on ATP synthesis. Furthermore, I utilised this skillset during my bachelor programme at Maastricht University, where I modelled and sculped a mosasaur for the Maastricht natural history museum, which we showcased as a hologram using the Pepper's ghost illusion technique.
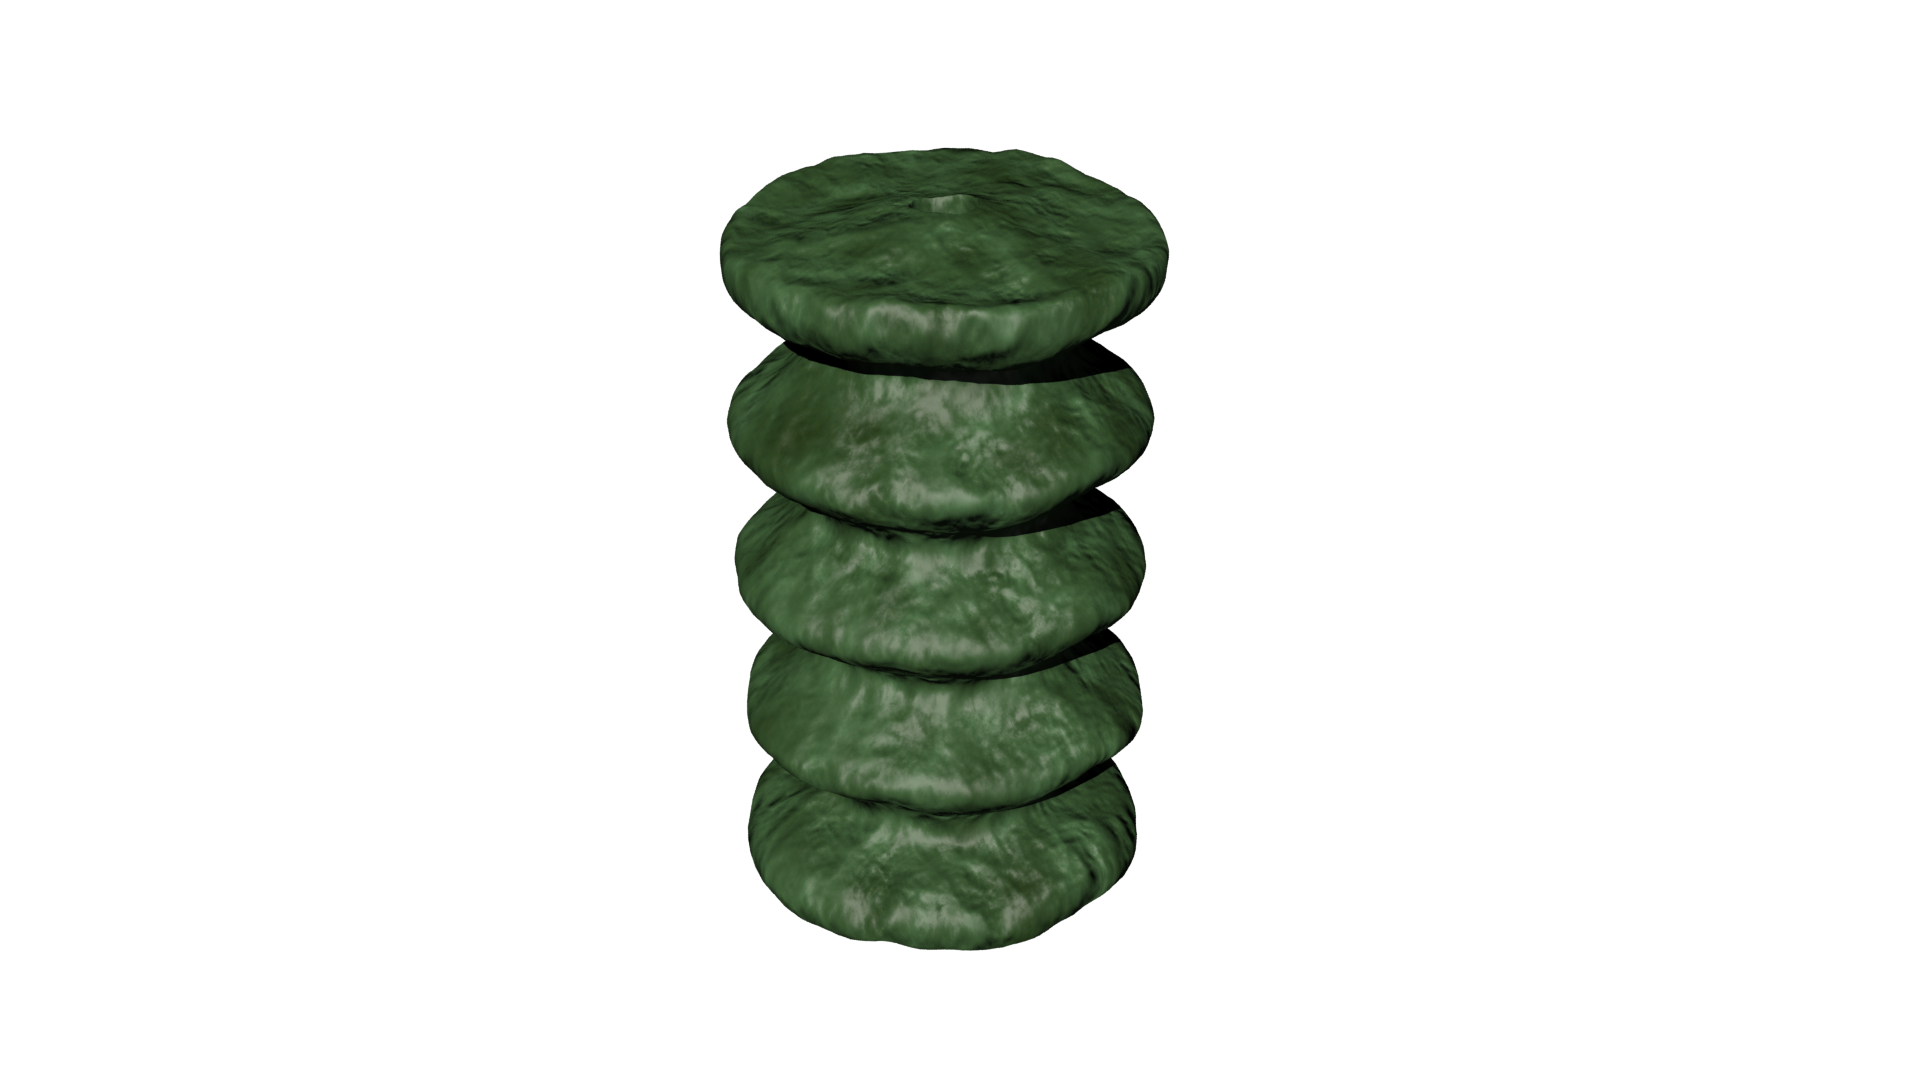
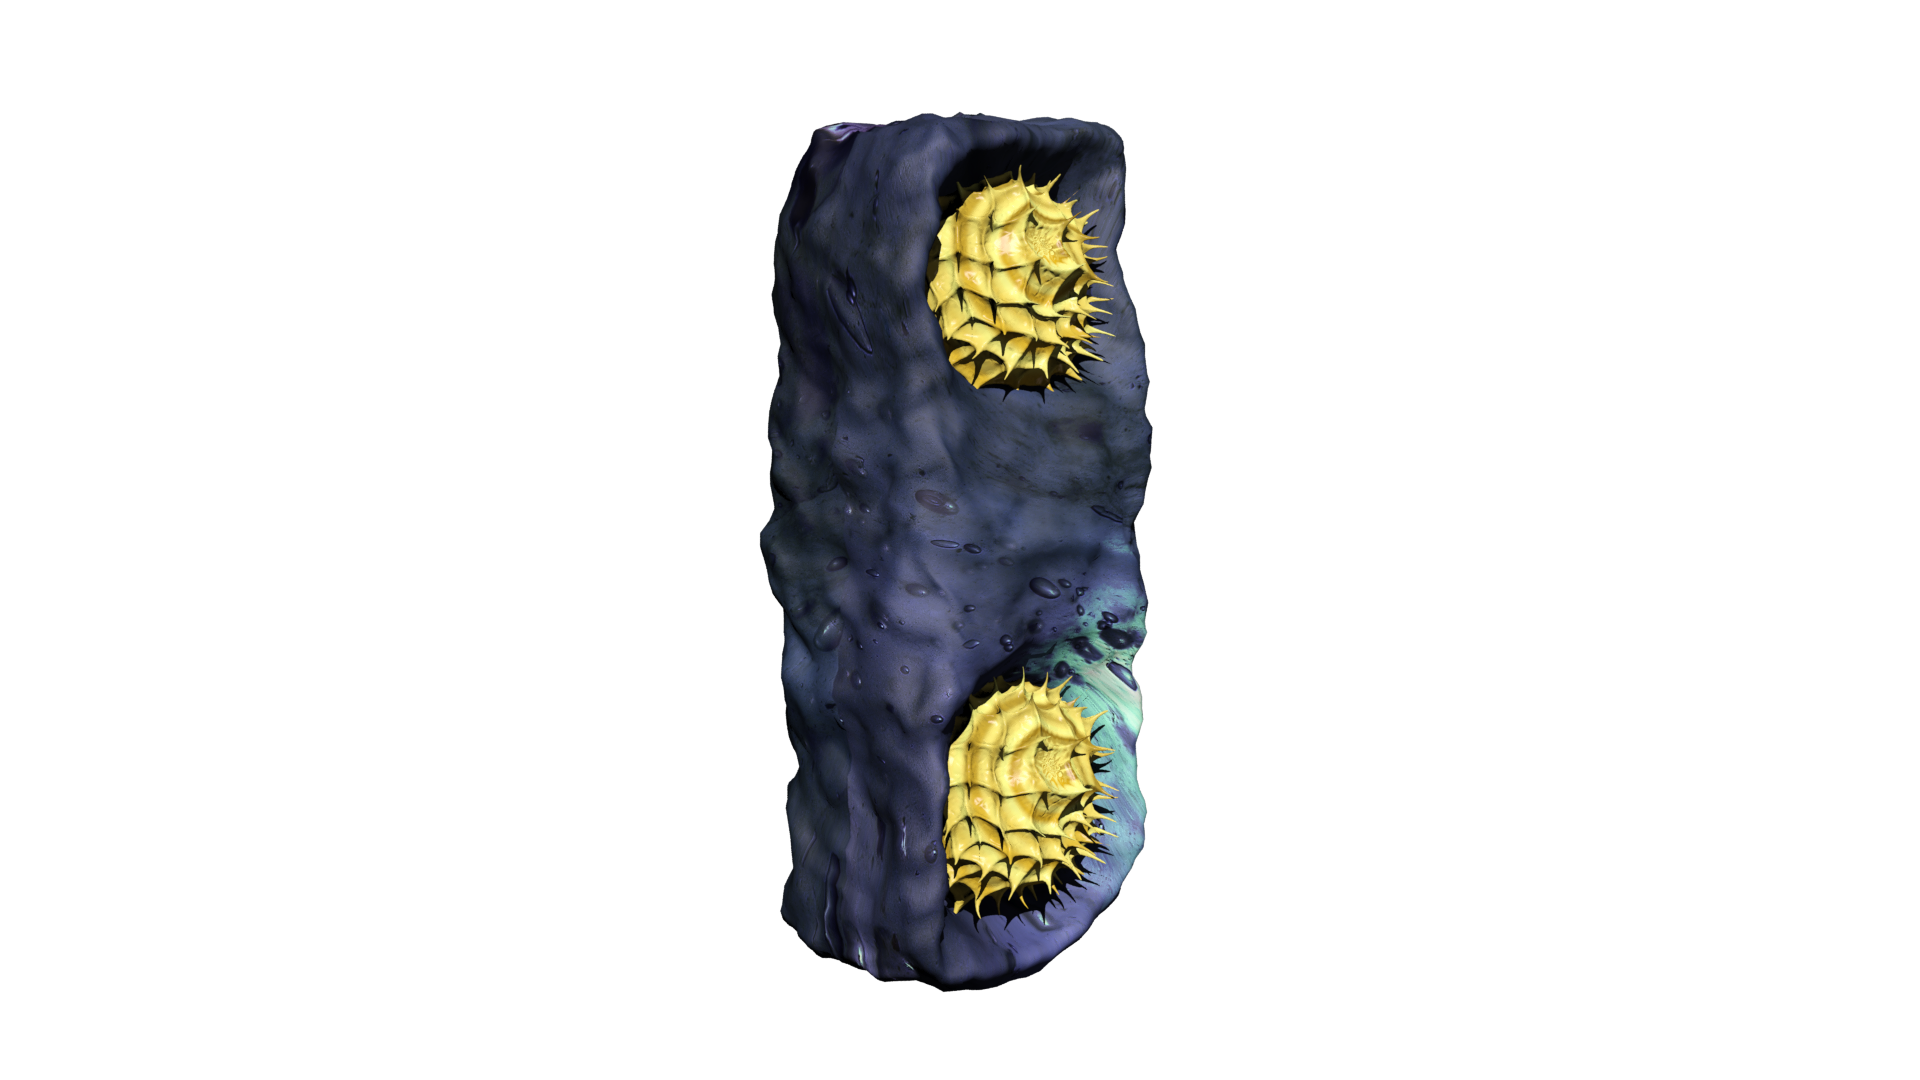
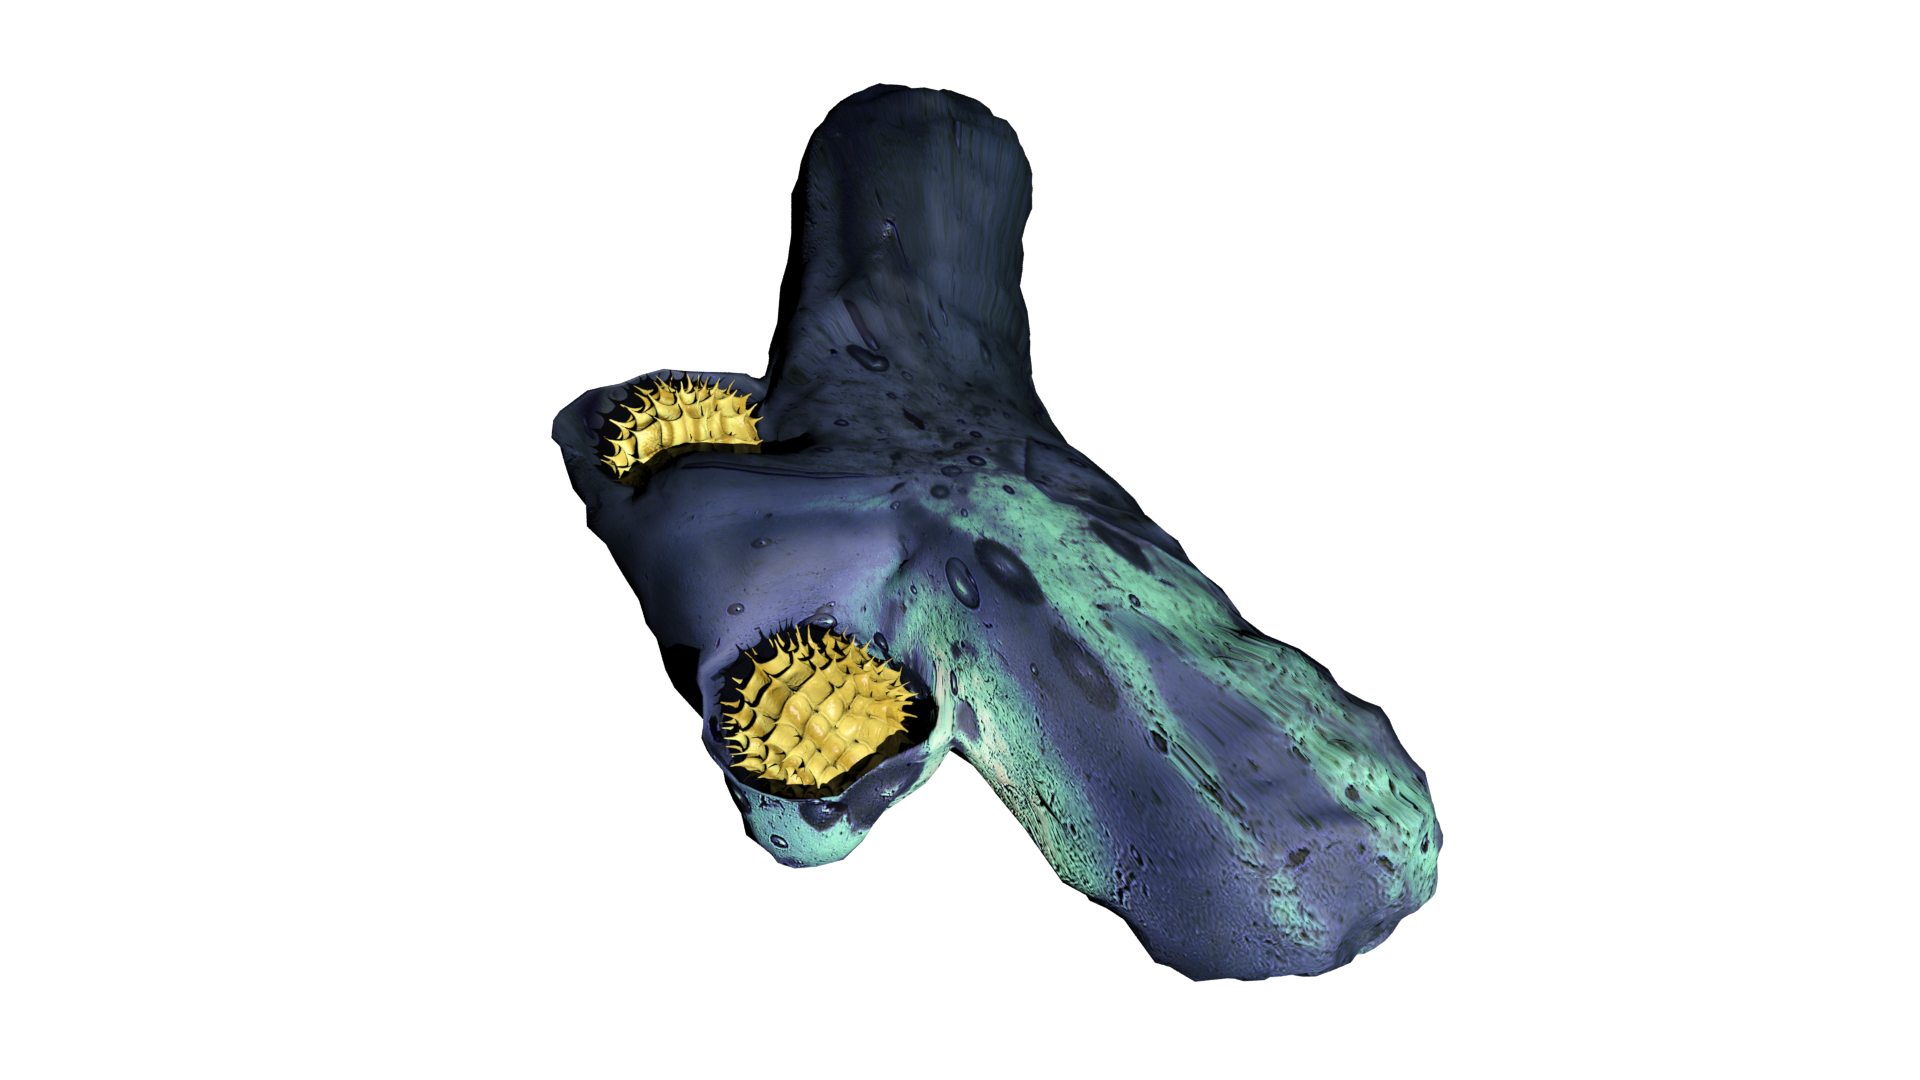
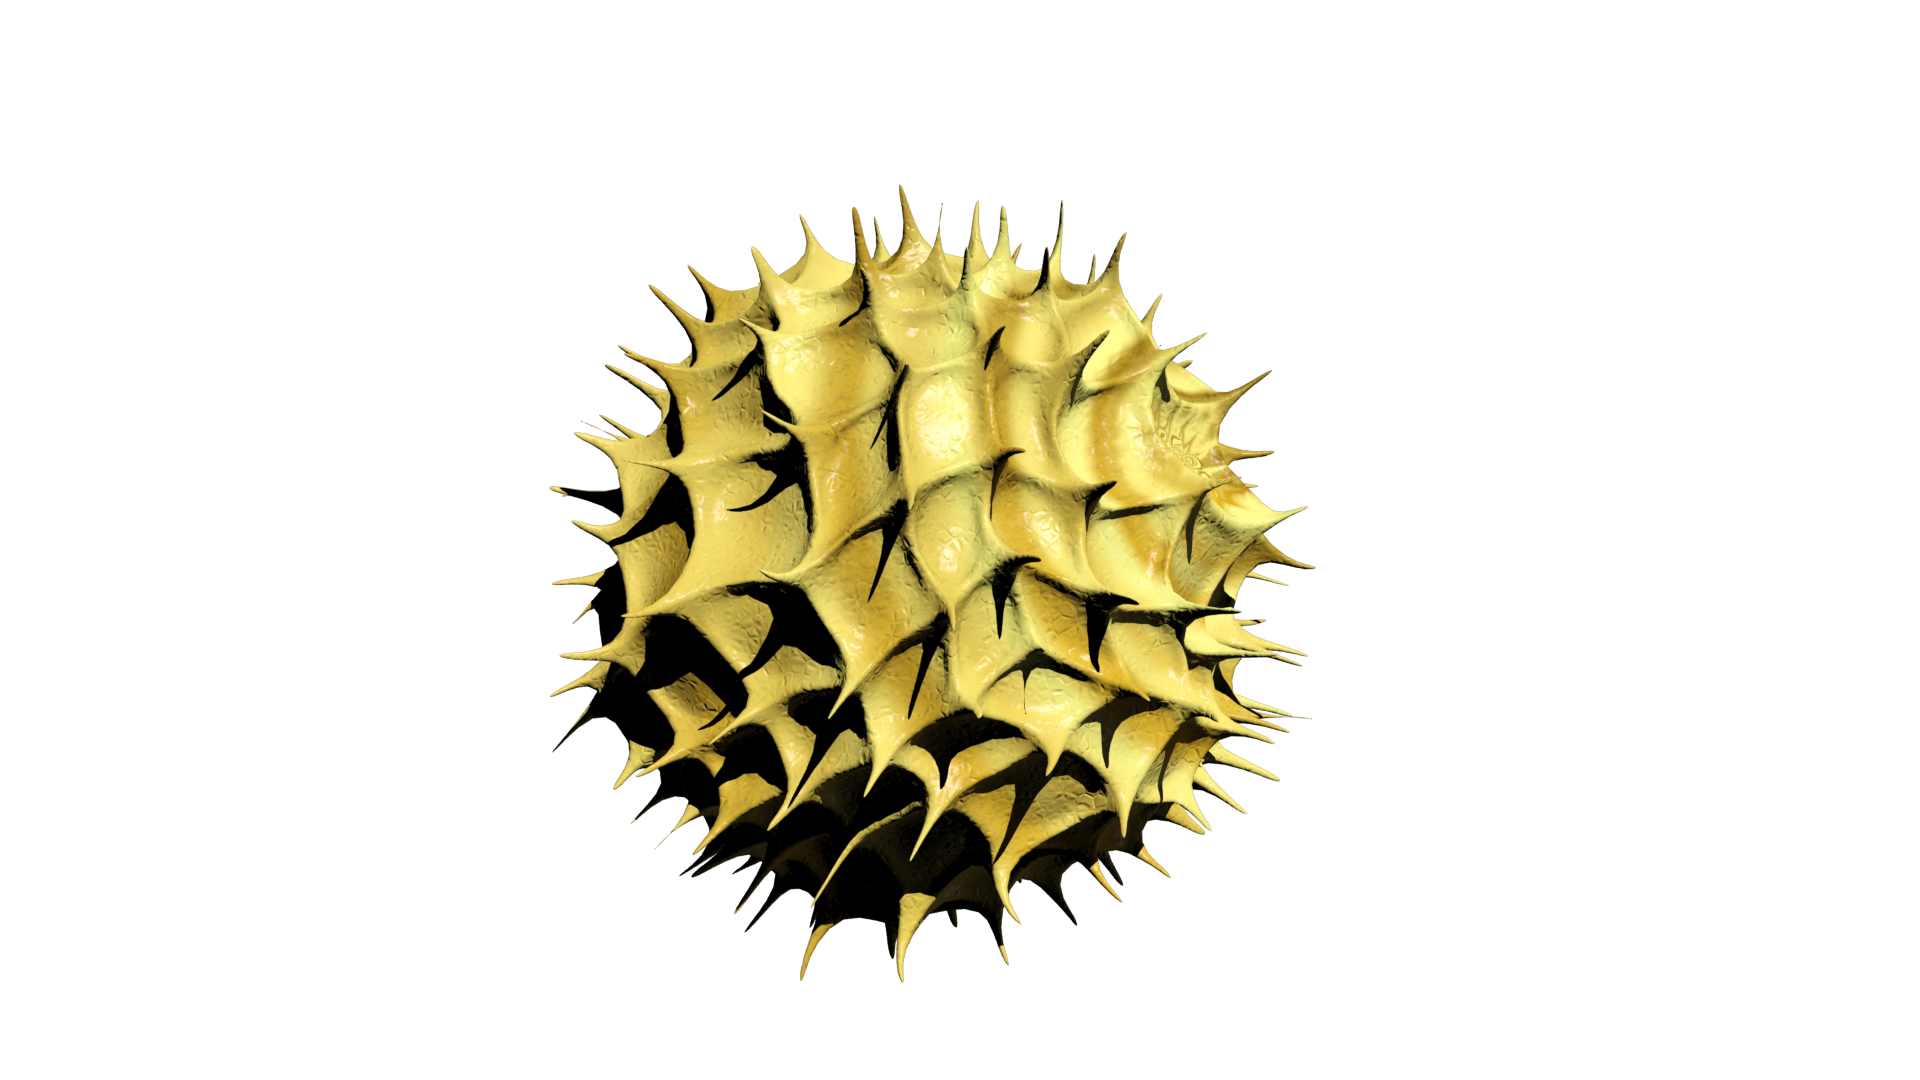
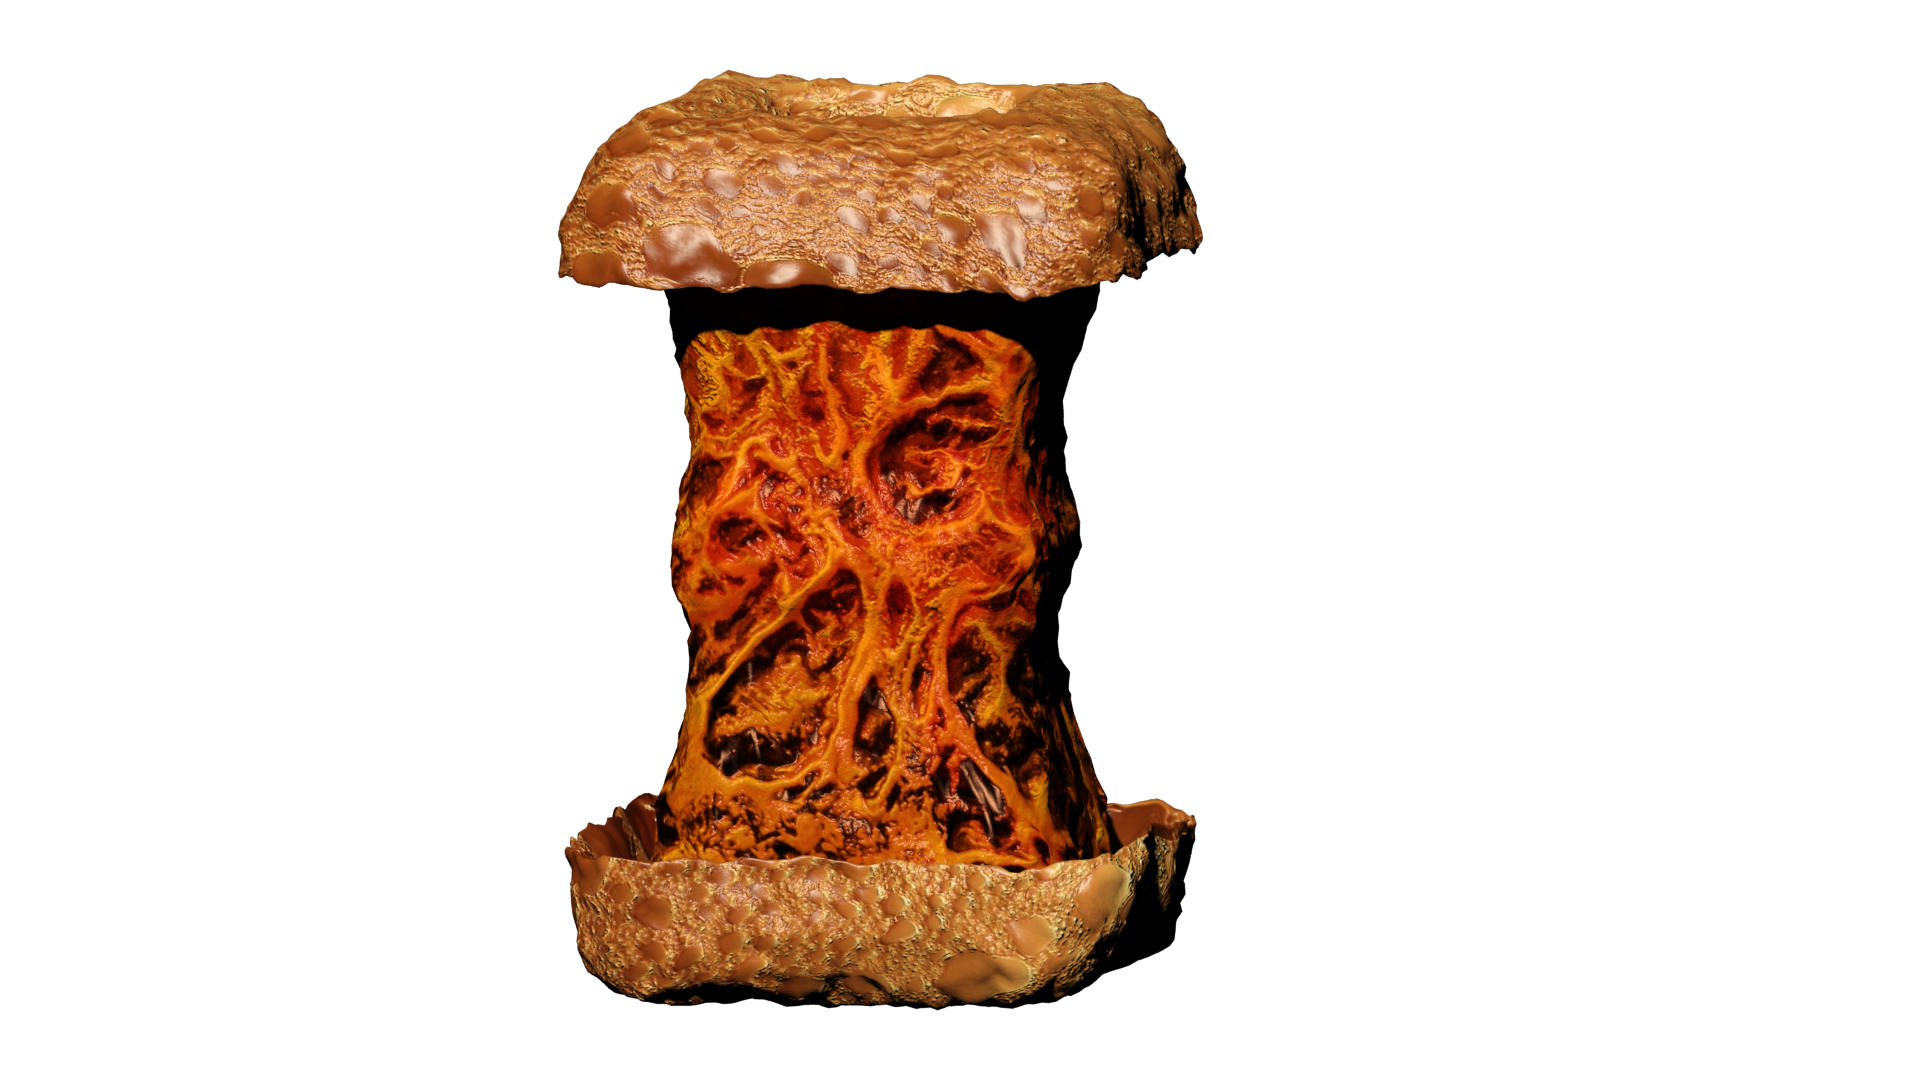
To illustrate some of the objecsts that I have modeled in 3D I have incorporated a turntable with which you can observe and rotate a few of my 3D models, feel free to give it a go!
.png)
Logo Design
During high school I would often draw and explore digital design using software like Adobe Illustrator, Photoshop and After Effects. Although, I never really focussed on this type of design, I got rather handy with the software and was therefore offered some opportunities to create logos for a few projects/departments of Maastricht University. One of which was from Phytome, a research financed by the European Commission to reduce nitrite, which are carcinogenic components, in red meat products to eliminate its cancer inducing properties. Additionally, I designed a logo for the Honours Programme of the Faculty of Health, Medicine and Life Sciences at Maastricht University, an additional curriculum for the elite students of the faculty. These logos, and a few more are illustrated in a slideshow below.

